The Real Time Dashboard has been simplified to provide insights into your inventory operations, so you can easily see the big picture.
Video
Overview of Real-Time section of Dashboard
Three Main Widgets - Real-Time Inventory, Non-Expendable Items Issued, and Serialized Items
The three main widgets/charts on the dashboard are located on the left side of the screen. The real time inventory you may have seen before, but the Non-Expendable Items Issues and Serialized Items widgets are new with the next generation FR TRAC software.
Real-Time Inventory
This widget allows you to see real-time data about all sports, broken down into each sport, or you can choose a sport in the dropdown menu outlined below which will break it down into category within the sport.
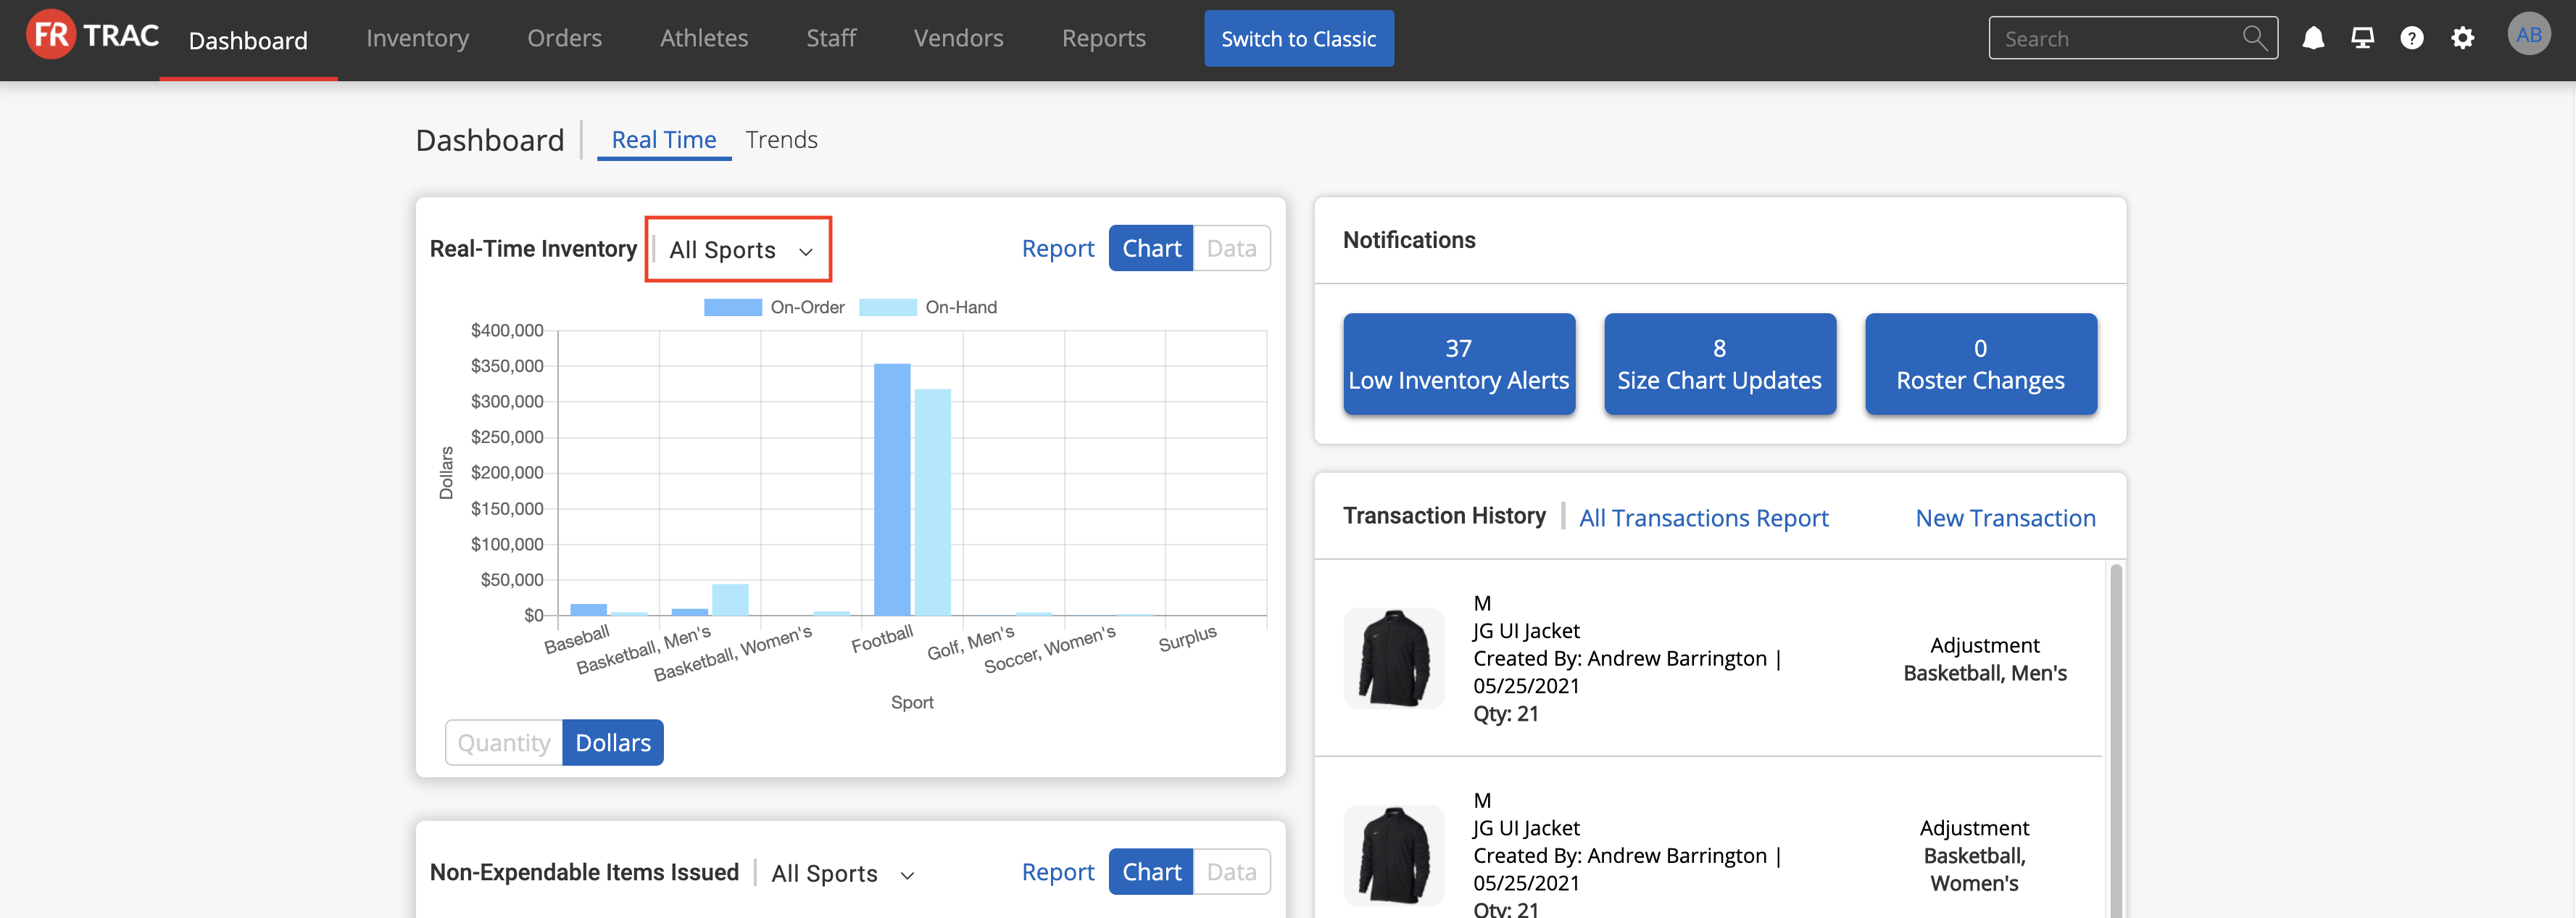
You can also choose to view the chart in dollars of inventory or quantity, and quickly change between the two by selecting one of the two options below.

You can also just view the data which makes up the chart for each sport by selecting the data tab outlined below.

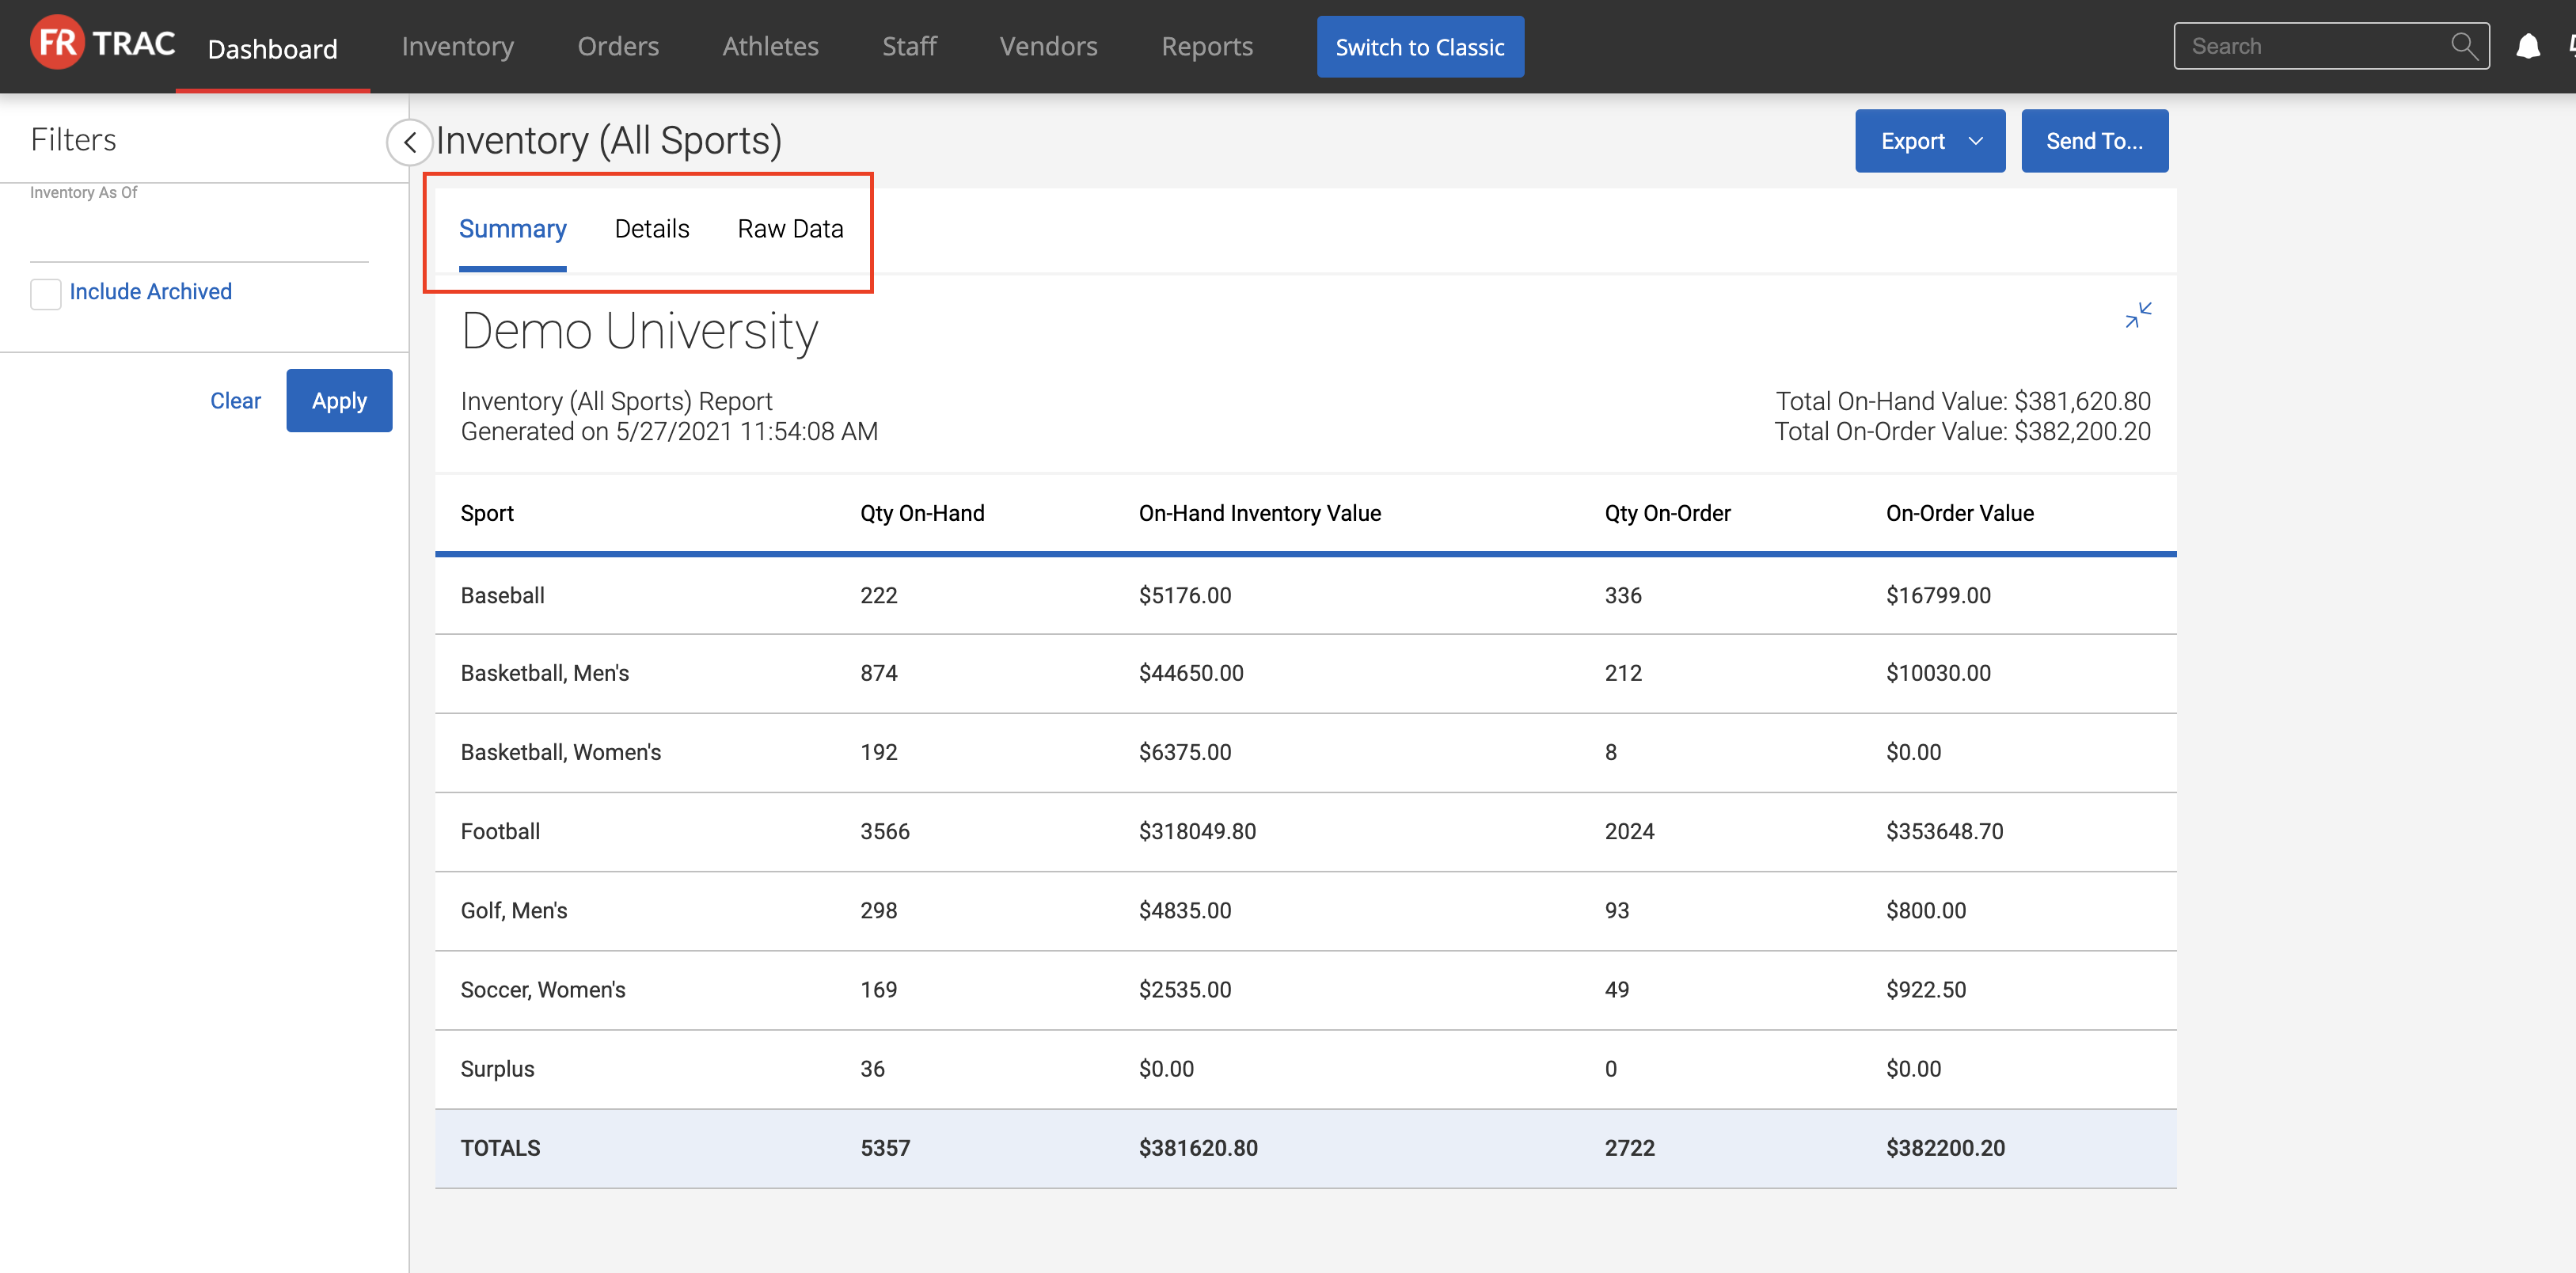
If you select the report button outlined in the first photo below, you will be taken to the reports page shown in the second photo below. From here you can change to a detailed view, or see raw data across all sports by choosing one of the options outlined in the second picture.

Non-Expendable Items Issued (New)
This widget shows a graph of how many non-expendable items have been issued in each sport. This is a quick way to view how many items need to be returned for each sport. You can also see the raw data that makes up the chart by selecting the Data tab circled below.

To only view the non-expendable items issued for one sport, click the all sports button at the top of the page to see the dropdown menu in the photo below and select a sport.

Serialized Items (New)
Organized by sport, this widget shows how many serialized items are issued and not issued for each category within the sport. Sport is changed through the same drop-down menu as the other two widgets above, and to access the data which makes up the chart it is also the same process as above, just select the Data button in the upper right corner.

The report button circled below breaks down info and brings you to summary page, where you can also select the raw data tab in the second photo below, which is all active serialized items.

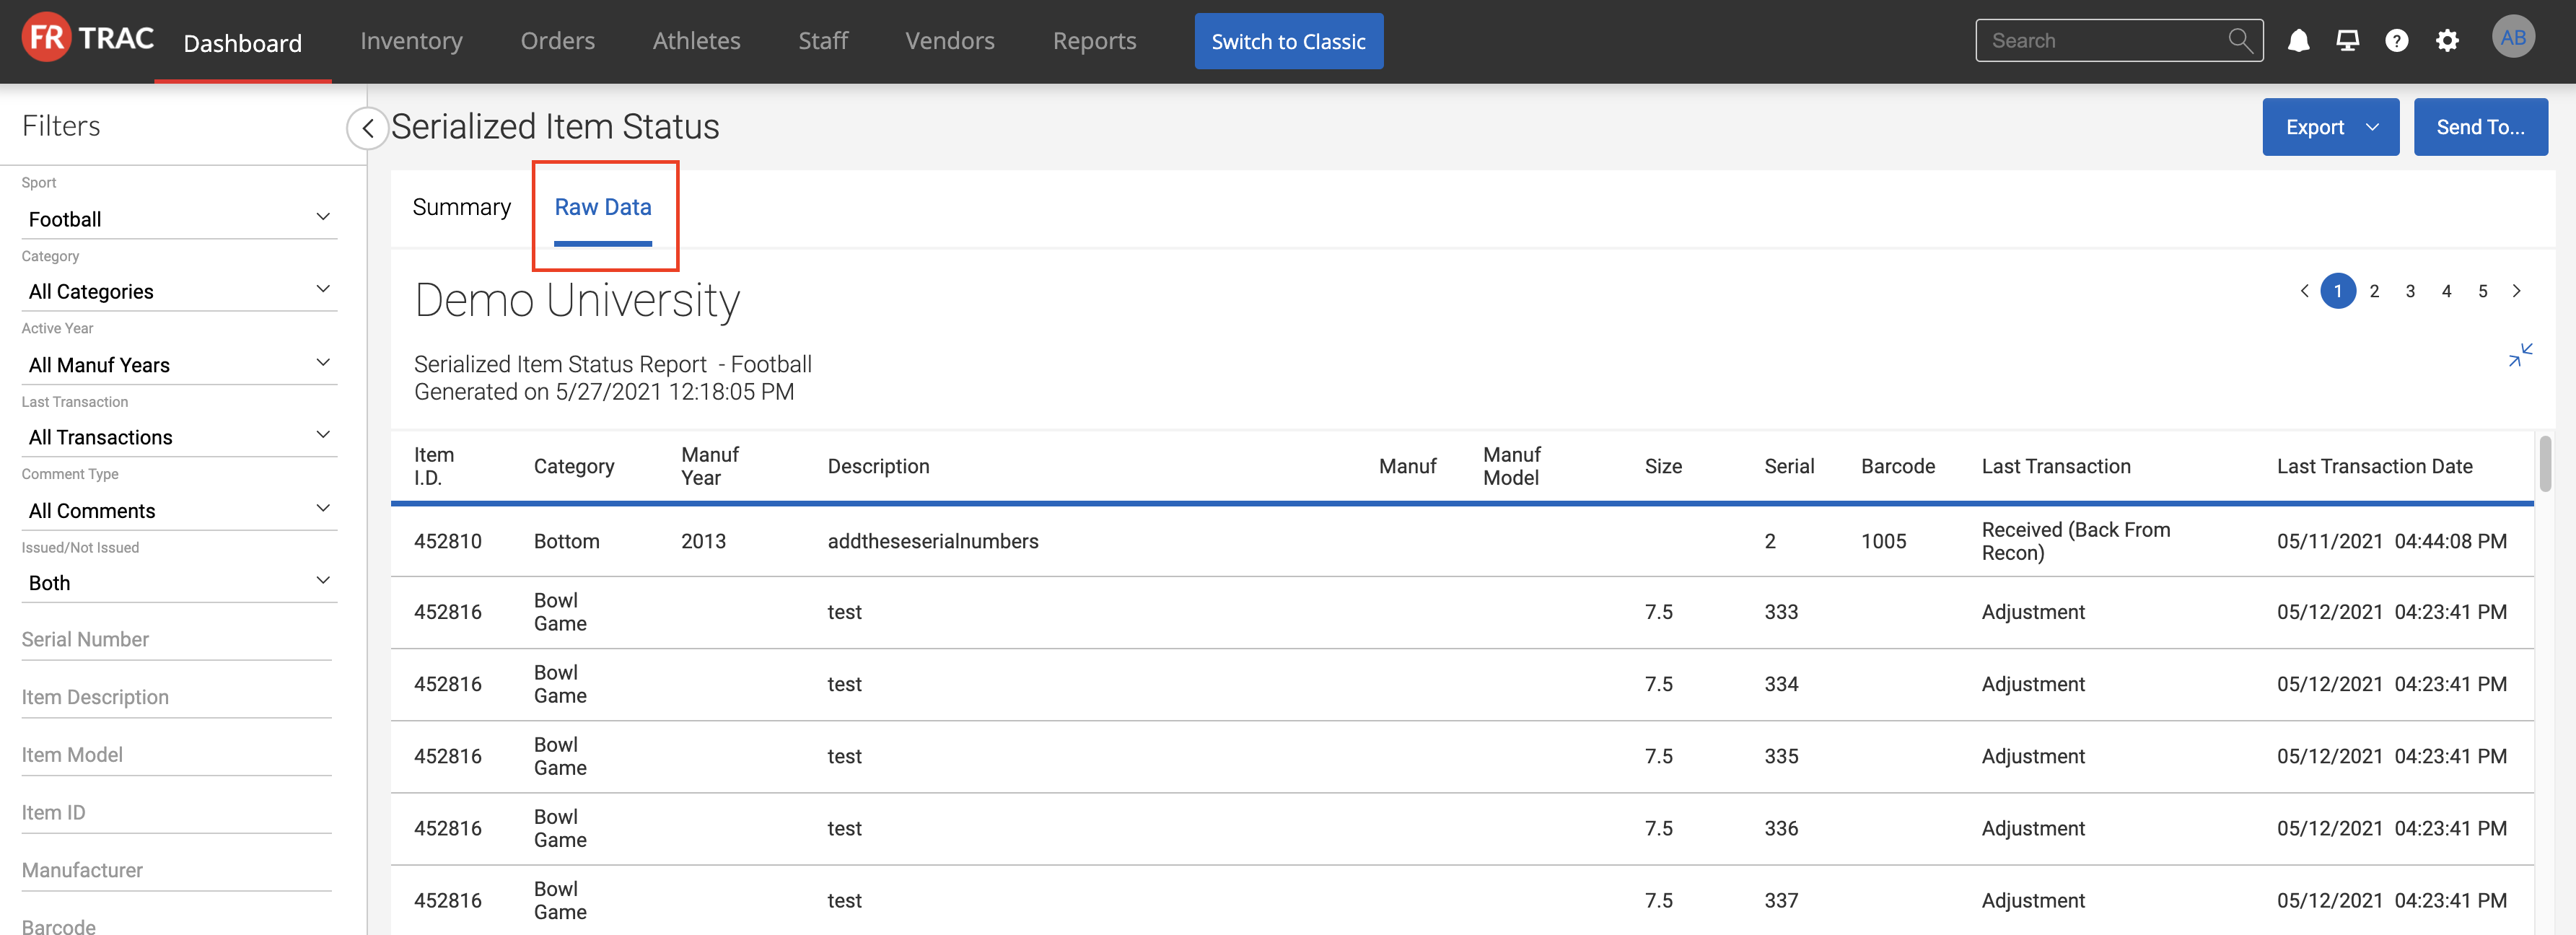
Within the raw data page, there is a new filter on the left side of the page, circled below, to sort for issued or non-issued serialized items.

Notifications
From here you will see roster changes if you are a part of the compliance program for roster management, size chart updates that need to be approved, and a list of low inventory items.
To access and approve size charts, select the size chart tab circled in the first photo below. Within the window which will pop up, shown in the second photo below, you can select individual updates and hit approve in the bottom right corner, or you can select all in the upper left and approve those.


The low inventory tab, when selected, will show the latest 20 alerts in the pop-up window. To view all, hit the report button in the pop-up window, this is shown below. Like any reports, you can quickly export with the export button to send to whoever needs it!

Transaction History
This section shows you real-time transactions as they are created on the mobile app or on the web interface. This allows you to see if other employees are currently working within the platform and can see any transactions that have recently occurred!
The all transactions button circled below, takes you to a page where you can see the raw data for all transactions.

The New Transaction button, in the photo below, takes you to a page where you can complete a new transaction, such as receiving an order, issuing an item, or receiving an item.
